
Executive summary
Infrastructure monitoring (or « bits & bytes monitoring » as I call it) and security monitoring are often operated as two separate disciplines. Centreon provides detailed visibility into the health and availability of infrastructure, while Wazuh focuses on security monitoring, log analysis, threat detection, and incident response. But what if events generated by Centreon could also become part of the data available to Wazuh?
This article demonstrates how to integrate Centreon monitoring events into the Wazuh security platform by exporting Centreon Broker events as structured JSON via a Lua output module. A Wazuh agent then collects these events and forwards them to the Wazuh manager for storage, search, and correlation. The goal is to unify infrastructure monitoring and security telemetry without replacing either tool. This architecture enables richer incident context by combining service/host health data with security alerts. The key benefit is improved visibility and faster root-cause analysis through cross-domain event correlation.
Note: The reader is expected to have a basic knowledge of both tools.
Architecture overview
Here is a high-level overview of the processed data:

The objective is not to replace Centreon with Wazuh. Each platform continues to perform the job for which it was designed. Instead, the integration makes infrastructure monitoring events available alongside security telemetry.
For example, Centreon might report that a service unexpectedly stopped responding while Wazuh simultaneously detects authentication failures, suspicious processes, or other security events affecting the same system. Bringing both sources together provides additional context that can be useful during investigations.
Exporting Centreon events
Centreon Broker is the component that collects, processes, transforms, and routes monitoring events and performance data generated by Centreon Engine to various outputs such as databases, logs, and external systems. It supports Lua extensions that can process events handled by the broker. We can take advantage of this capability to create an additional output that serializes selected events into JSON.
Rather than storing only Centreon’s internal identifiers (difficult to read and interpret from the human eyes), the Lua script can enrich the generated records with information such as:
- Host ID and hostname
- Service ID and service description
- Event category and type
- Service state
- State type
- Plugin output
- Performance metrics
- Event timestamp
Each event is written as an individual JSON object on a single line, effectively producing a JSON Lines or NDJSON file.
This format is particularly convenient because the file remains append-only and can easily be processed by tools such as jq, while the Wazuh agent can continuously monitor newly appended records.
Centreon Broker JSON output configuration
Below is a concrete example of a Centreon Broker configuration that enables a Lua output module to export events as JSON. In this example, the Lua script is responsible for transforming Centreon events into structured JSON and writing them to /var/log/centreon-broker/events.json.
Extract from /etc/centreon-broker/central-broker.json:
{
  "type": "lua",
  "name": "JSONDump",
  "path": "/usr/share/centreon-broker/lua/jsondump.lua",
  "lua_parameter": [
    {
      "name": "logfile",
      "value": "/var/log/centreon-broker/events.json",
      "type": "string"
    }
  ]
}
The Broker can be reconfigured from the Centreon web interface:
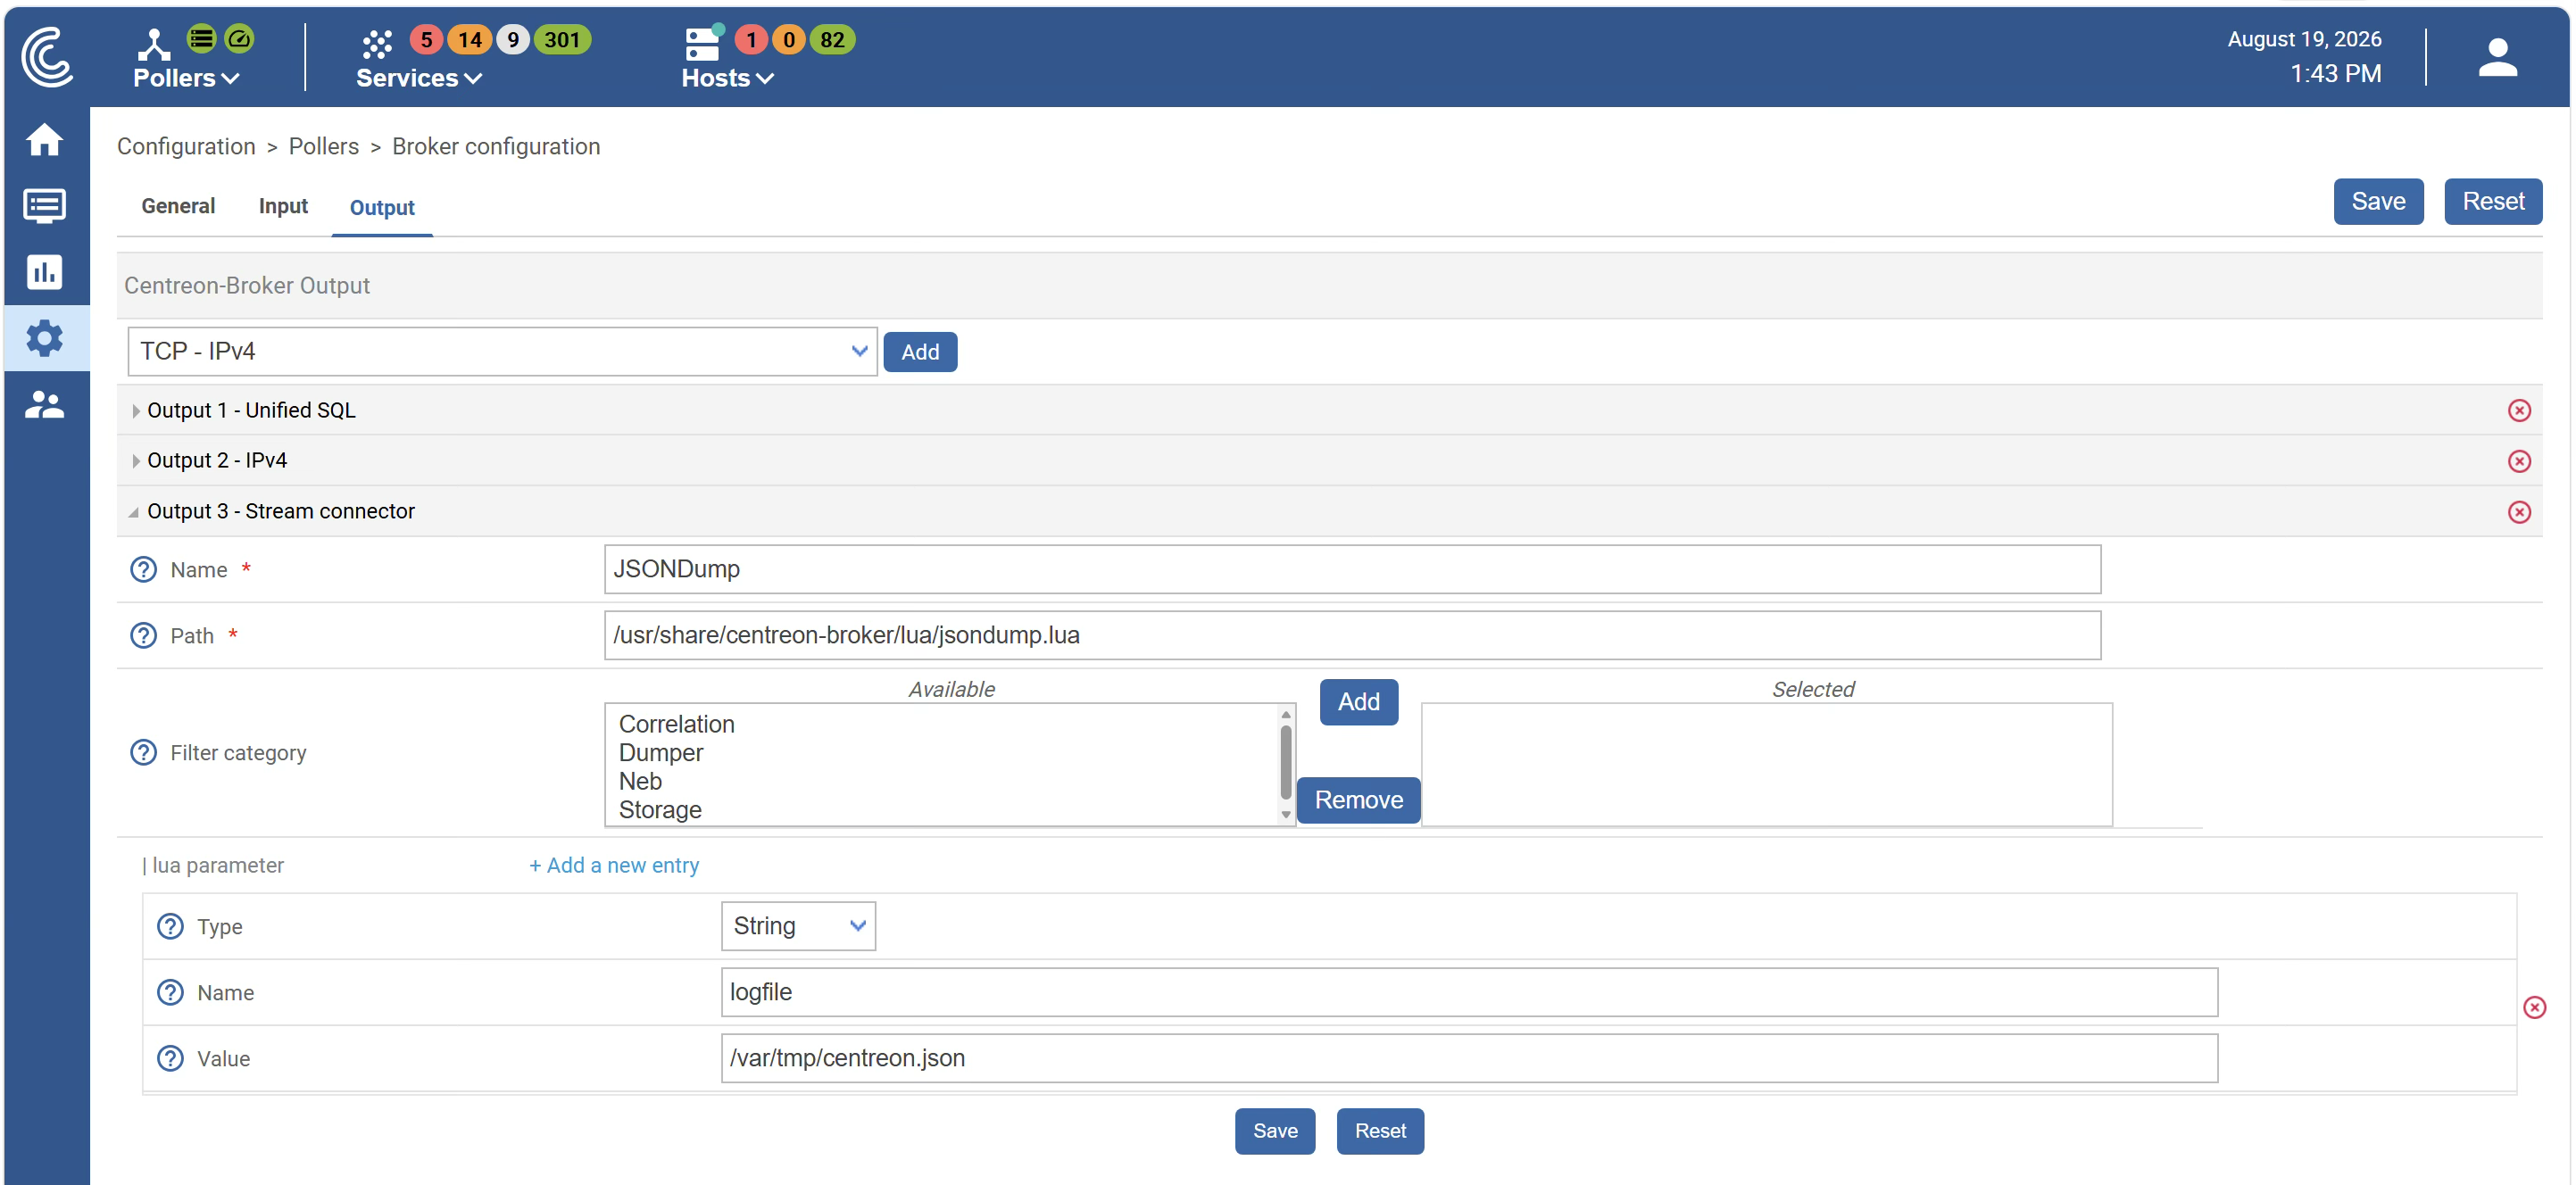
Create a new output of type “Stream connector”. Path will contain the Lua script responsible of the JSON events creation.
A copy of the Lua script is available on my GitHub repository.
Example Lua event transformation
Inside the Lua script (jsondump.lua), each Centreon event is converted into a JSON object. A simplified example of the output produced by the script is shown below.
Each line in the output file represents a single event. For readability, the JSON below has been formatted with whitespace.
{
  "performance_data": "rta=0.000ms;3000.000;5000.000;0; pl=100%;80;100;0;100 rtmax=0.000ms;;;; rtmin=0.000ms;;;; ",
  "event": {
    "category": "NEB",
    "type": "host_status",
    "category_id": 1,
    "element_id": 32
  },
  "timestamp": 1786609012,
  "downtime": {
    "depth": 0
  },
  "host": {
    "name": "demo.xameco.be",
    "id": 53
  },
  "acknowledgement": {
    "type": 0
  },
  "status": {
    "state_type_code": 1,
    "code": 1,
    "name": "DOWN",
    "state_type": "HARD",
    "attempt": 3,
    "check_type": "ACTIVE",
    "check_type_code": 0
  },
  "raw": {
    "scheduled_downtime_depth": 0,
    "output": "CRITICAL - 192.168.50.12: rta nan, lost 100%",
    "last_time_up": 1786608594,
    "acknowledgement_type": 0,
    "category": 1,
    "check_type": 0,
    "next_host_notification": 0,
    "last_time_unreachable": 1764669862,
    "checked": true,
    "next_check": 1786609312,
    "notification_number": 1,
    "last_state_change": 1786608964,
    "state": 1,
    "last_hard_state": 0,
    "_type": 65568,
    "last_time_down": 1786609024,
    "element": 32,
    "should_be_scheduled": true,
    "last_notification": 1786609024,
    "no_more_notifications": false,
    "latency": 0.531,
    "check_attempt": 3,
    "perfdata": "rta=0.000ms;3000.000;5000.000;0; pl=100%;80;100;0;100 rtmax=0.000ms;;;; rtmin=0.000ms;;;; ",
    "execution_time": 9.468312,
    "long_output": "",
    "state_type": 1,
    "host_id": 53,
    "flapping": false,
    "percent_state_change": 5.9868421052632,
    "last_hard_state_change": 1786609024,
    "last_check": 1786609012
  },
  "message": "CRITICAL - 192.168.50.12: rta nan, lost 100%"
}
In this example, a host was reported down (100% packets lost).
Collecting the events with Wazuh
Once Centreon Broker is generating the JSON event stream, the Wazuh agent can monitor the file using a “localfile” configuration.
For example:
<localfile>
  <location>/var/log/centreon-broker/events.json</location>
  <log_format>json</log_format>
  <label key="@source">centreon</label>
</localfile>
The Wazuh agent detects new records appended to the file and forwards them for processing.
Because Centreon already produces structured information, keeping the events in JSON avoids having to parse traditional human-readable log messages with complex regular expressions.
Once Centreon events are ingested as JSON, Wazuh can automatically parse and classify them using the built-in JSON decoder. Example output from wazuh-logtest demonstrates the decoded structure:
**Phase 2: Completed decoding.
        name: 'json'
        acknowledgement.type: '0'
        downtime.depth: '0'
        event.category: 'NEB'
        event.category_id: '1'
        event.element_id: '32'
        event.type: 'host_status'
        host.id: '53'
        host.name: 'demo.xameco.be'
        message: 'CRITICAL - 192.168.50.12: rta nan, lost 100%'
        performance_data: 'rta=0.000ms;3000.000;5000.000;0; pl=100%;80;100;0;100 rtmax=0.000ms;;;; rtmin=0.000ms;;;; '
        raw._type: '65568'
        raw.acknowledgement_type: '0'
        raw.category: '1'
        raw.check_attempt: '3'
        raw.check_type: '0'
        raw.checked: 'true'
        raw.element: '32'
        raw.execution_time: '9.468312'
        raw.flapping: 'false'
        raw.host_id: '53'
        raw.last_check: '1786609012'
        raw.last_hard_state: '0'
        raw.last_hard_state_change: '1786609024'
        raw.last_notification: '1786609024'
        raw.last_state_change: '1786608964'
        raw.last_time_down: '1786609024'
        raw.last_time_unreachable: '1764669862'
        raw.last_time_up: '1786608594'
        raw.latency: '0.531000'
        raw.next_check: '1786609312'
        raw.next_host_notification: '0'
        raw.no_more_notifications: 'false'
        raw.notification_number: '1'
        raw.output: 'CRITICAL - 192.168.50.12: rta nan, lost 100%'
        raw.percent_state_change: '5.986842'
        raw.perfdata: 'rta=0.000ms;3000.000;5000.000;0; pl=100%;80;100;0;100 rtmax=0.000ms;;;; rtmin=0.000ms;;;; '
        raw.scheduled_downtime_depth: '0'
        raw.should_be_scheduled: 'true'
        raw.state: '1'
        raw.state_type: '1'
        status.attempt: '3'
        status.check_type: 'ACTIVE'
        status.check_type_code: '0'
        status.code: '1'
        status.name: 'DOWN'
        status.state_type: 'HARD'
        status.state_type_code: '1'
        timestamp: '1786609012'
Creating custom rules for Centreon events
Now we can define rules that trigger alerts based on specific monitoring states.
Create a dedicated rule file such as /var/ossec/etc/rules.d/centreon_rules.xml.
Rule: Host DOWN event
<group name="centreon,availability,">
  <rule id="100100" level="12">
    <decoded_as>centreon-json</decoded_as>
    <field name="event.type">host_status</field>
    <field name="host_state">1</field>
    <description>Centreon: Host is DOWN - $(host.name)</description>
    <group>availability,host_down,</group>
  </rule>
</group>
Rule: Critical service state
<group name="centreon,services,">
  <rule id="100101" level="10">
    <decoded_as>centreon-json</decoded_as>
    <field name="event.type">service_status</field>
    <field name="service.state">2</field>
    <description>Centreon: Critical service detected on $(host.name) - $(service.name)</description>
    <group>service,critical,</group>
  </rule>
</group>
Optional: Warning state rule
<rule id="100102" level="5">
  <decoded_as>centreon-json</decoded_as>
  <field name="service.state">1</field>
  <description>Centreon: Service warning on $(host.name) - $(service.name)</description>
  <group>service,warning,</group>
</rule>
What these rules enable?
With these rules in place, Wazuh can now:
- Trigger alerts when a host goes down
- Raise incidents when a service becomes critical
- Correlate infrastructure failures with security events
- Feed dashboards with real-time monitoring status
For example:
- A host marked as DOWN in Centreon can be correlated with SSH brute-force attempts detected by Wazuh
- A critical database service can be correlated with suspicious SQL activity or authentication anomalies
Using metric events for performance monitoring
In addition to host and service status events, Centreon Broker generates metric events containing the performance data collected by monitoring plugins, such as CPU utilization, memory usage, disk space, network throughput, response time, or packet loss.
Example of metric event:
{
  "@source": "centreon",
  "centreon": {
    "storage_index": {
      "id": 28695
    },
    "host": {
      "name": "pm1.finland.xameco.int",
      "id": 122
    },
    "element_id": 9,
    "metric": {
      "name": "traffic_in",
      "id": 1131,
      "value": 730.88000488281,
      "unit": "b/s"
    },
    "event_timestamp": 1787143538000,
    "category": "STORAGE",
    "service": {
      "name": "Interface_vmbr4000",
      "id": 734
    },
    "category_id": 3,
    "event_type": "metric"
  }
}
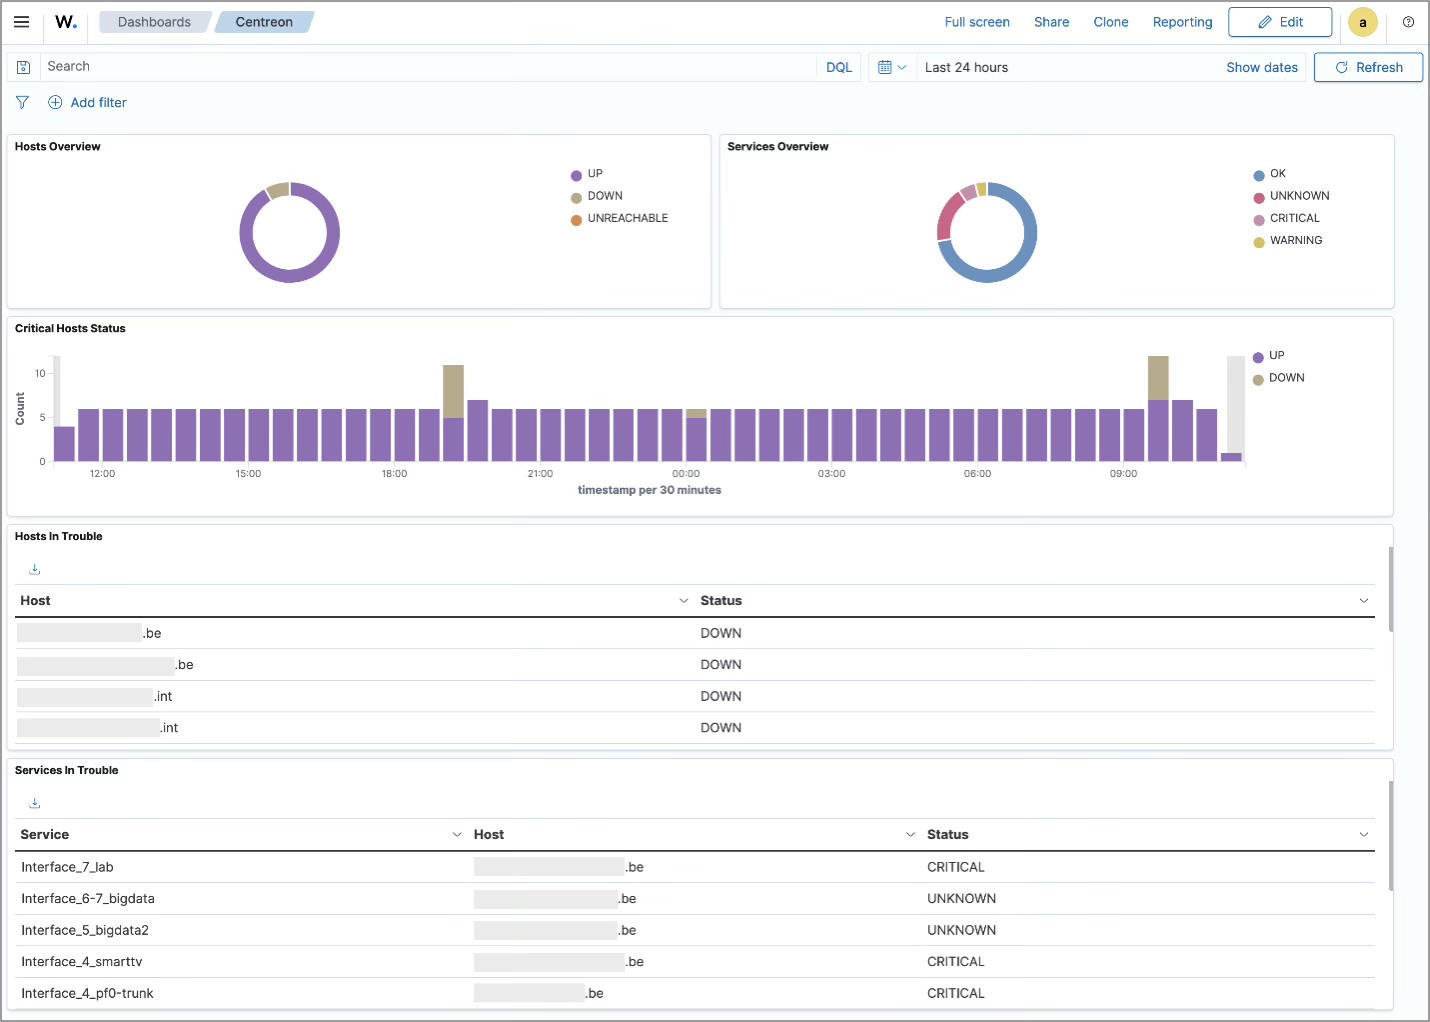
By exporting these events to Wazuh, their numeric values can be indexed and used to build performance dashboards and time-series visualizations, providing an operational view alongside security events. Metric values can also be evaluated by custom Wazuh rules to generate alerts when a predefined condition is reached.
For example, when the CPU utilization of a monitored host exceeds 90%. This makes it possible not only to correlate security events with service availability, but also with changes in system performance, such as an unusual CPU spike occurring at the same time as suspicious activity detected by Wazuh.
Example of Dashboard
Production considerations
Before deploying this integration in a production environment, several operational aspects should be taken into account.
Log rotation and file growth
The JSON export file (/var/log/centreon-broker/events.json) will grow continuously. It is important to configure proper log rotation using logrotate to avoid disk exhaustion. A typical configuration might rotate daily or when a size threshold is reached, while ensuring that Wazuh continues to read the active file without interruption. Care must be taken to use copytruncate or a post-rotation signal strategy so that the Wazuh agent does not lose events during rotation.
Performance impact of Lua export
The Lua output module runs inside the Centreon Broker pipeline. While lightweight transformations are generally safe, excessive processing or complex serialization logic can introduce overhead. Key recommendations:
- Keep Lua transformations minimal and non-blocking
- Avoid heavy computations or external calls inside the script
- Prefer simple field mapping and JSON serialization
- Monitor Centreon Broker latency under load
In high-throughput environments, it may be preferable to export only selected event types rather than all NEB events (drop metric events)
Wazuh agent file monitoring limits
Wazuh file monitoring is efficient, but not unlimited. When monitoring high-frequency log sources, consider the following:
- Each monitored file consumes system resources (inotify or polling depending on configuration)
- Extremely high event rates may require tuning of logcollector settings
- JSON parsing adds overhead compared to plain text logs, although it is generally efficient
- Ensure the agent has sufficient CPU and memory headroom in large-scale environments
If Centreon generates a very high volume of events, filtering at the source (Lua side) is recommended to reduce noise before ingestion into Wazuh.
From monitoring events to security context
Simply importing Centreon events into Wazuh is useful for centralized searching, but the real value of the integration comes from what can be done with the resulting data.
Custom Wazuh rules can identify interesting Centreon events, such as hosts becoming unreachable or critical services changing state. Dashboards can provide an infrastructure-oriented view alongside existing security information.
More importantly, Centreon events can provide additional operational context during security investigations.
A server becoming unreachable may simply indicate an infrastructure problem. The same event occurring shortly after Wazuh detects suspicious activity on that server is considerably more interesting.
By combining both sources of information, operational events can become another piece of telemetry available to security analysts. Centreon remains the monitoring platform. Wazuh remains the security platform. The integration simply allows them to share what they know.
Happy monitoring!
[This article is part of the Wazuh Ambassador Program.]